Analysis & tools
Charting
One question many new traders ask is, "How will I analyse the markets?" One of the most common ways is through the use of price charts:
What are price charts?
Price charts plot the recent prices of a currency pair on a graph and provide a snapshot of market movements over a particular period of time.
Line charts
Line charts are one of three common chart types that most traders use. They provide a quick way to view the changes in price movements over a period of time.

Bar & candlestick charts
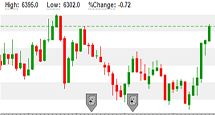
Bar and candlestick charts provide an easy-to-analyse appearance that displays detailed information about the price movements of a market.

Each bar or candle on the chart is defined by four price points (high, low, open and close). The length of the bar or candle represents the level of trading activity for a specified period. For example, on a chart with a ten-minute time scale, a bar or candle would represent all of the trading activity on the market in a ten-minute period. When the price of an instrument rises, the bar or candle appears one colour (usually green) and when the price of an instrument drops, the bar or candle appears another (usually red).
Most traders switch between different time frames so that they can compare market movements and verify trends. In Tradefair PRO, for example, you can select to view charts with time frames as small as a tick all the way up to one year.
Technical analysis: what is it?
If you're familiar with trading other financial products, you know that traders tend to hold on to their positions for as long as the market moves their way. If the market moves against them, they tend to reverse or close their position quickly.
Technical analysis is the study of repeating patterns and movements in the market caused by the pattern-like behaviour of traders. Traders use technical analysis to monitor the current and historical price movements of a currency pair, help determine market trends and forecast potential entry and exit points for their trades.
Because no two traders are alike, there are hundreds of technical analysis tools and methods to choose from.
Some of the most common are:
Support and resistance levels
These levels are price points that the market consistently hits and then reverses its direction. Support usually refers to points that the price drops to but never breaks through before rising again. Resistance refers to points that the price rises to but never breaks through before dropping again.
Indicators
These display trend lines either over the recent market movements on a chart or in a separate area below the chart. Bollinger Bands, Average Directional Index (ADX) and Moving Averages are all examples of indicators. Indicators can be either lagging (these analyse past market price movements) or leading (these forecast future price movements).
Did you know? You can access more than 100 technical indicators in Tradfair PRO?
Patterns
A chart pattern is a series of price points that move in a particular arrangement and, once completed, forecast market movements. Some common patterns are flags, channels and triangles. You can also plot more complex patterns, such as ABCD patterns or Fibonacci levels.
Fundamental analysis: What is it?
As you watch the charts, you'll notice that events and news on the state of a particular country's or region's economy can cause markets to shoot up or down dramatically.
Fundamental analysis traders track these political, social and economic forces and then forecast whether the value of a currency will go up or down. Many new traders will develop their fundamental analysis skills by following news events and scheduled economic announcements. But there will be times when the price movements of an instrument won't behave as you believe it should based on your fundamental analysis. That's when it becomes important to incorporate technical analysis into your strategy as well.
Tradefair's fundamental analysis tools
Get real-time news from market leaders.
When you trade with Tradefair, you can receive up-to-the-second news and commentary from the following sources:
- Reuters* provides business, political and international news and commentary that may have an impact on the markets.
- Economic Calendar lists when economic reports are released by government organisations, central banks and private companies. You can also view actual statistics as well as historic and forecasted numbers.
Forex trading and trading of derivatives, with or without the use of Analysis Tools or any other system or service, presents substantial risk of loss. It is possible to lose substantially more than your initial deposit. The Analysis Tools provided do not take into account any persons objectives, financial situation or needs; therefore, traders should seek professional advice concerning trading. The issuer assumes no responsibility for Analysis Tool accuracy. Any information generated should be independently evaluated before any trades are placed based on this data. Past performance is not necessarily indicative of future results.
